This part of the guidance will talk you through the steps to get the data through Power Query once you have hold of all the pieces for the query.
Power Query DAX Query Input
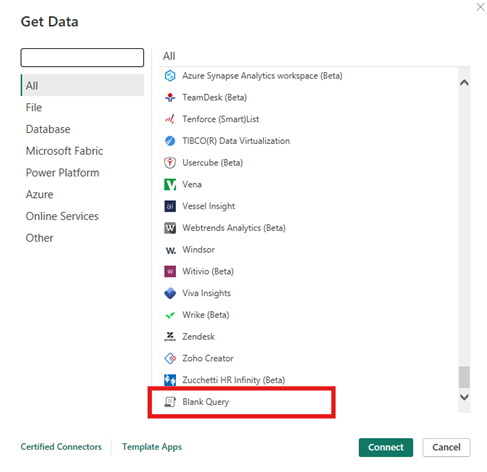
- In Power BI open a blank query source. This will open up Power Query Editor.
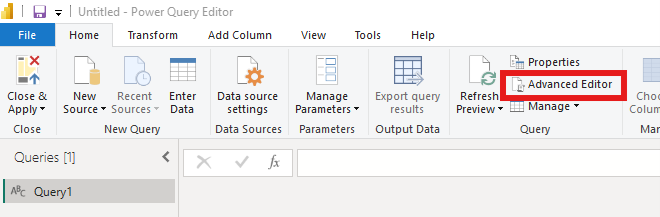
- In the Home tab select 'Advanced Editor'.
- Use the query template provided towards the end of the Using Stat-Xplore API in Power BI, with the highlighted sections replaced appropriately.
- Click the Done in the bottom right corner and you should see a table in Power Query Editor like the one shown below.
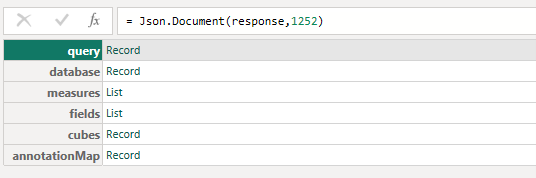
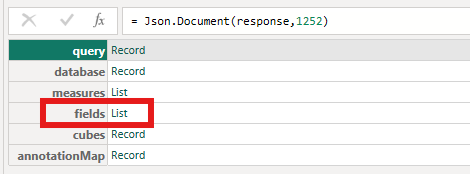
Transforming Table in Power Query
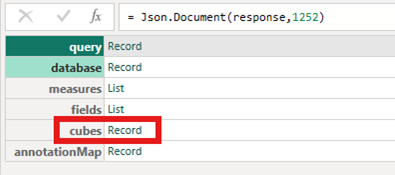
When we channel the data into Power Query it doesn't look as expected. We will need to do some manipulation in Power Query to create the table with the fields and values we want.
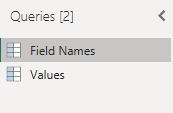
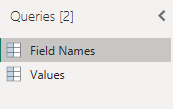
The Field Names and Values will need to be extracted separately into two tables which we can then merge at the end.
The Field Names in this example are the Regions and Month.
Values refer to the actual numbers.
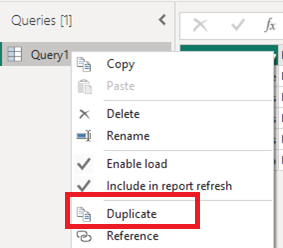
- Right click the query title in the left column and duplicate. We will need two queries - one to ectract the field labels and another to extract the values.
- Label them appropriately so you can distinguish between the query for the Field Names and the query for the Values.
Expanding Field Names Query
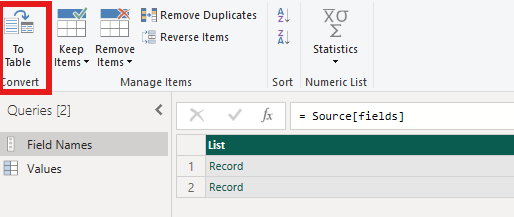
- Expand the list value under fields.
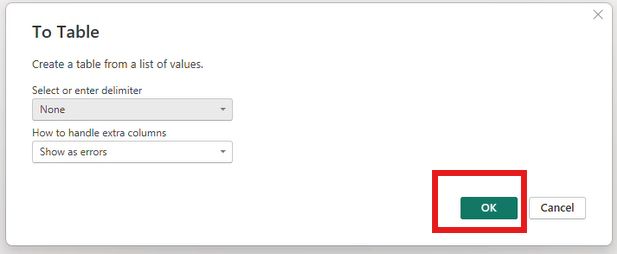
- You will get a list of records with as many columns as you added to your Stat-Xplore table. Convert this to table by clicking To Table.
- Click OK.
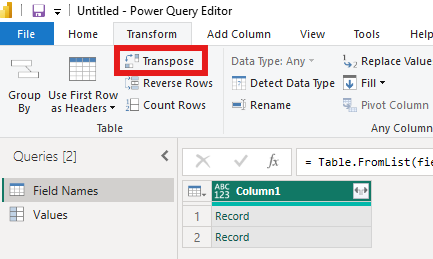
- Now in the Transform tab click the Transpose option so that the records become the columns.
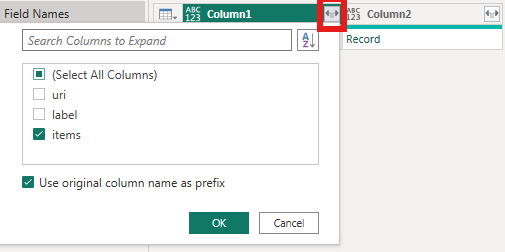
- Beginning with the first column click the expand the square in the right corner of the Column1 label and deselect everything except items. Click OK.
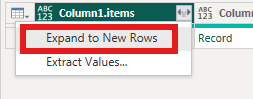
- The record value will change to List. Now click the expand button again and Expand to new rows.
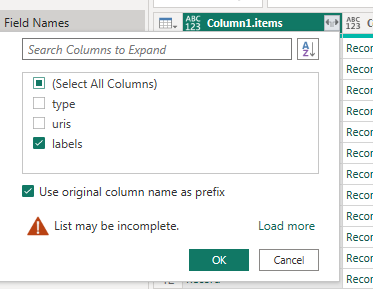
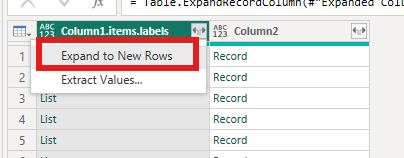
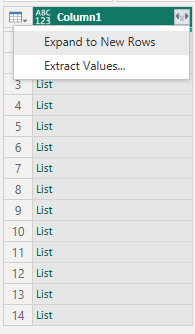
- You will now see a list of records. Click the expand button again and deselect all items except labels.
- The list of records will all have become List values. Click the expand square and Expand to New Rows again
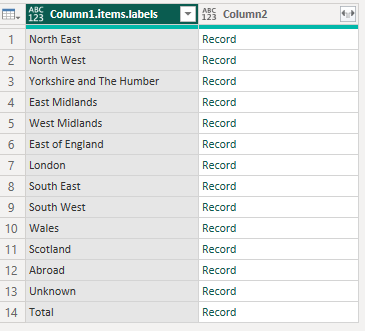
- And you should now have your field names for that column. Repeat steps 4-7 for any remaining columns.
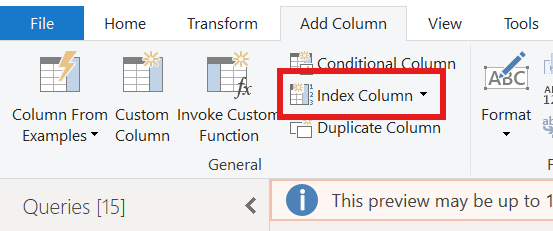
- Lastly add an index column. This can be found in the Add Column tab.
Expanding Values Query
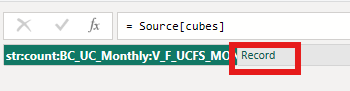
- To begin expanding the Value Query, first switch tabs to the 'Values' one we created earlier.
- Now to extract the values we want to click the 'Record' assigned to the cubes field.
- Click 'Record' again.
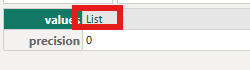
- Select 'List'.
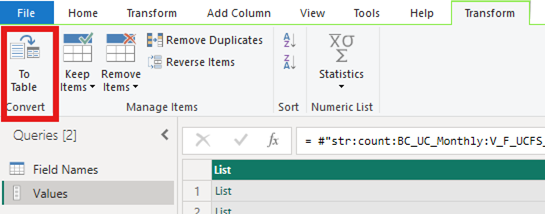
- Convert To Table.
- Expand to New Rows by selecting the small expand square in the corner.
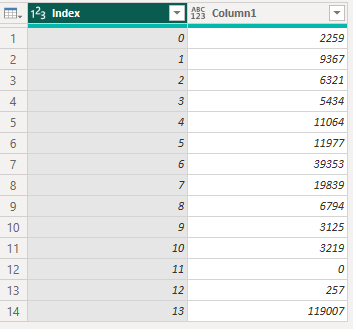
- Again, add an index cloumn so that the result is as shown below.
Merging Query Tables
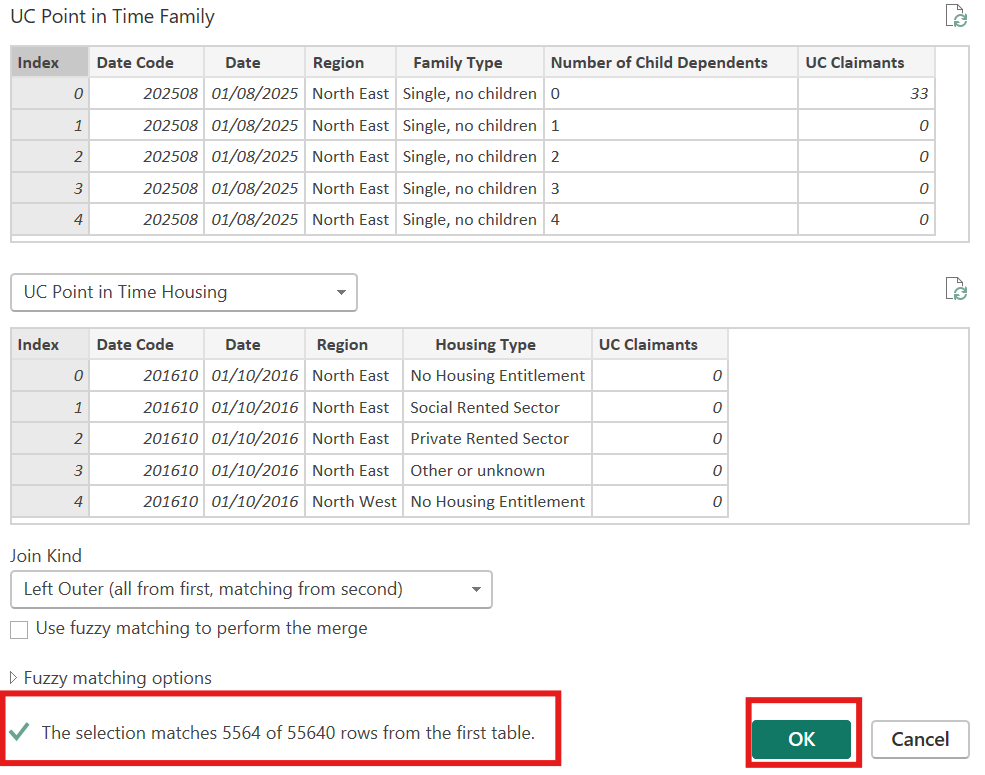
- The values are extracted in the same order as the field names. So we can do a merge on the index columns to create one table, where the rows will accurately match up.
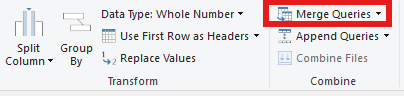
- Make sure you are on the Field Names query first. Under the home tab select 'Merge Queries'.
- On the drop down below select the 'Values' query. Click the index column from both tables so that they are highlighted grey.
- Make sure that the number of rows match at the bottom. This check will make sure that everything has been extracted correctly.
- If everything looks correct click OK.
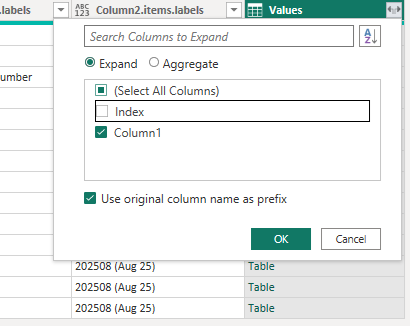
- The field names table will now have a column with the Values table. Click the expand the button from the Values colummn and deselct the Index column as shown. Click OK.
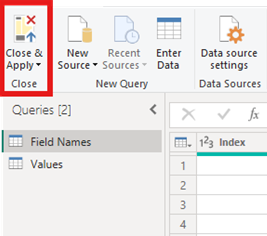
- You will now have your completed table. You can rename columns and transform data as you wish. Close and apply to begin visualising in Power BI.