If your table contains geographical data, then you can use Map View to display the results on a map. The Map View tab becomes enabled whenever you create a table containing a geographical field.
Create a Map
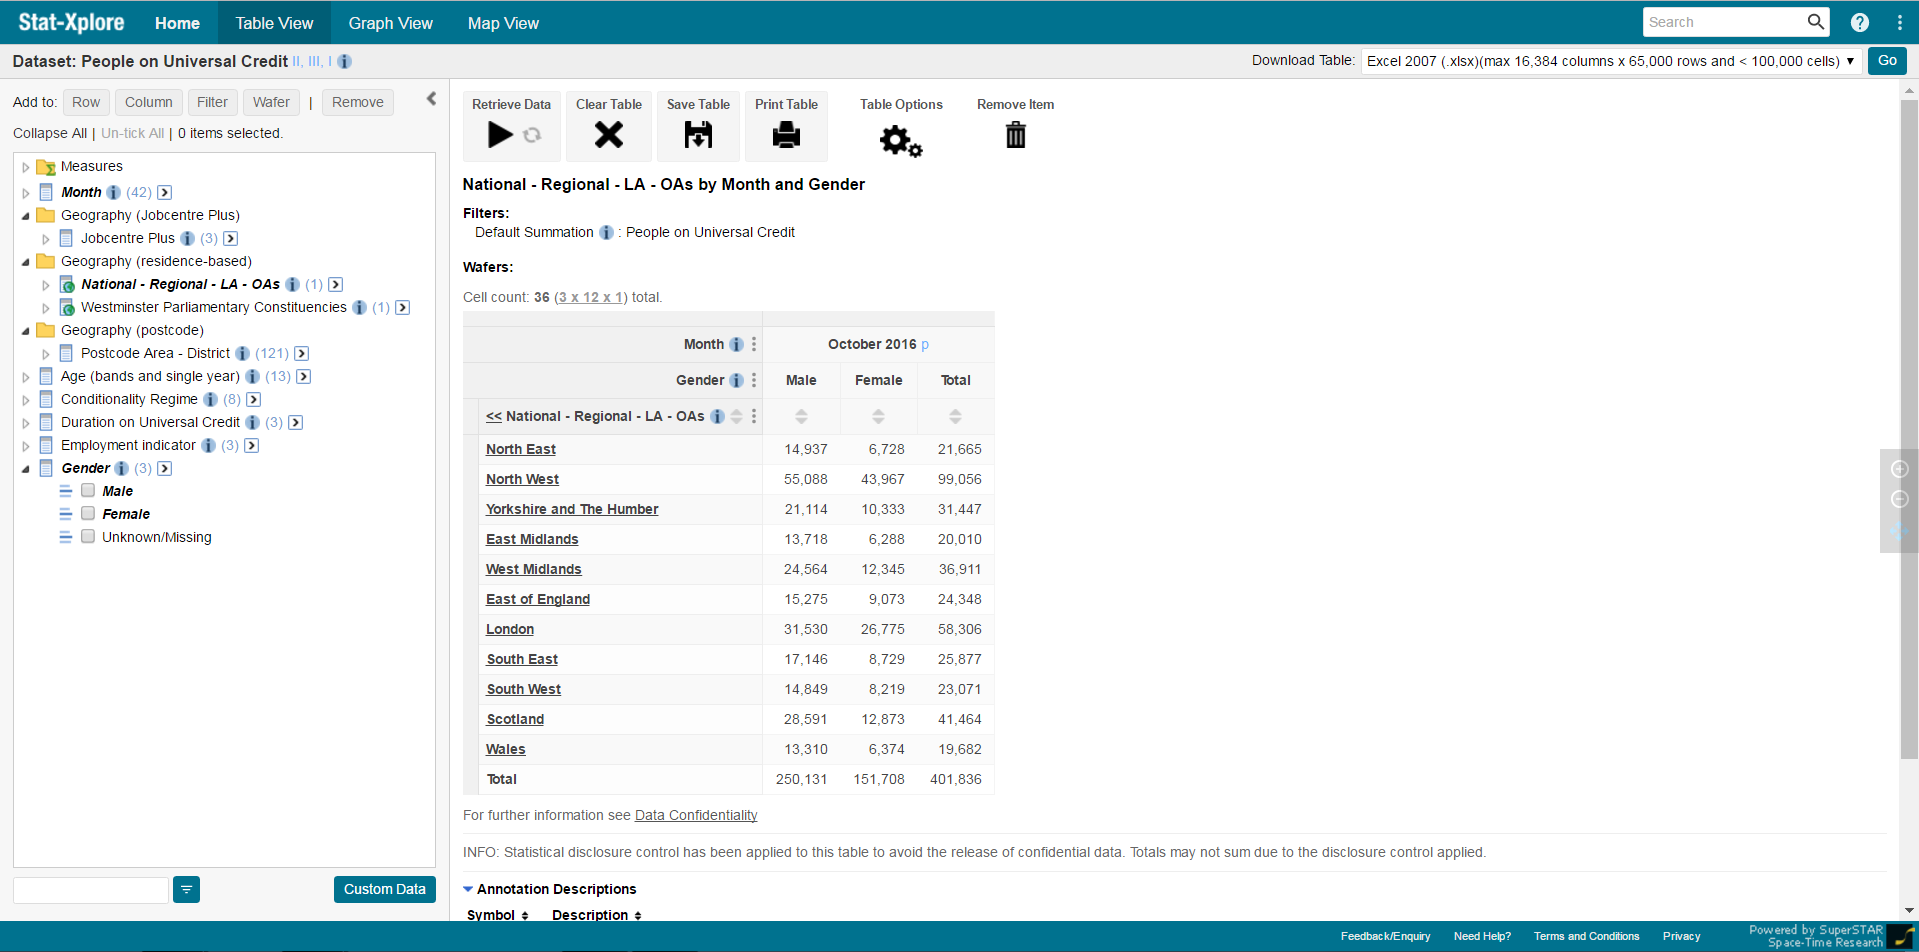
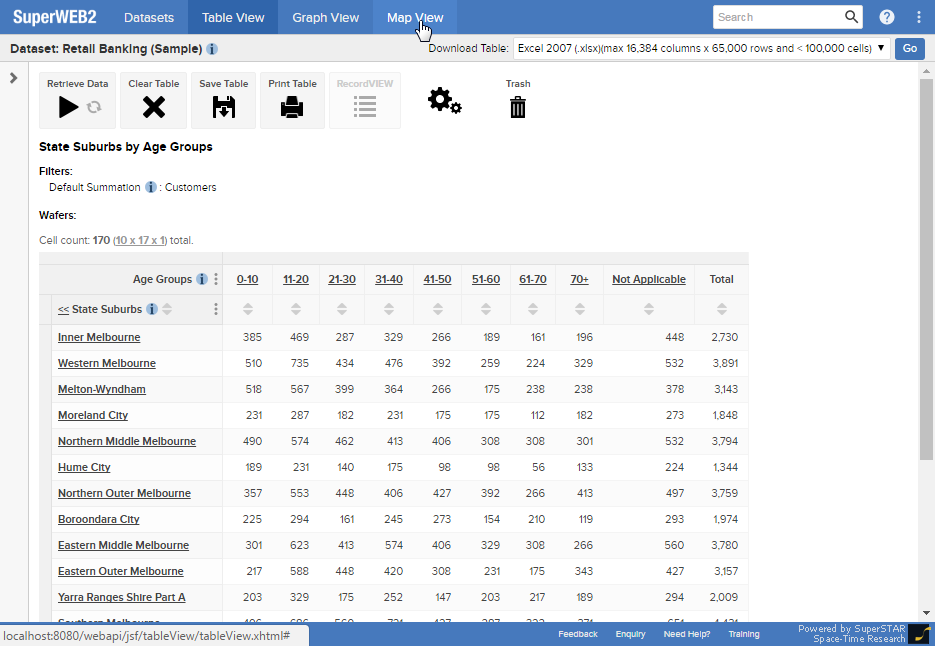
Create a table containing a geographical field. For example, using the sample People on Universal Credit dataset, create a table containing some values from the Region field.
The Map View table becomes active.
Click Map View:
Stat-Xplore starts building the map. Depending on the complexity of your table, this may take some time.

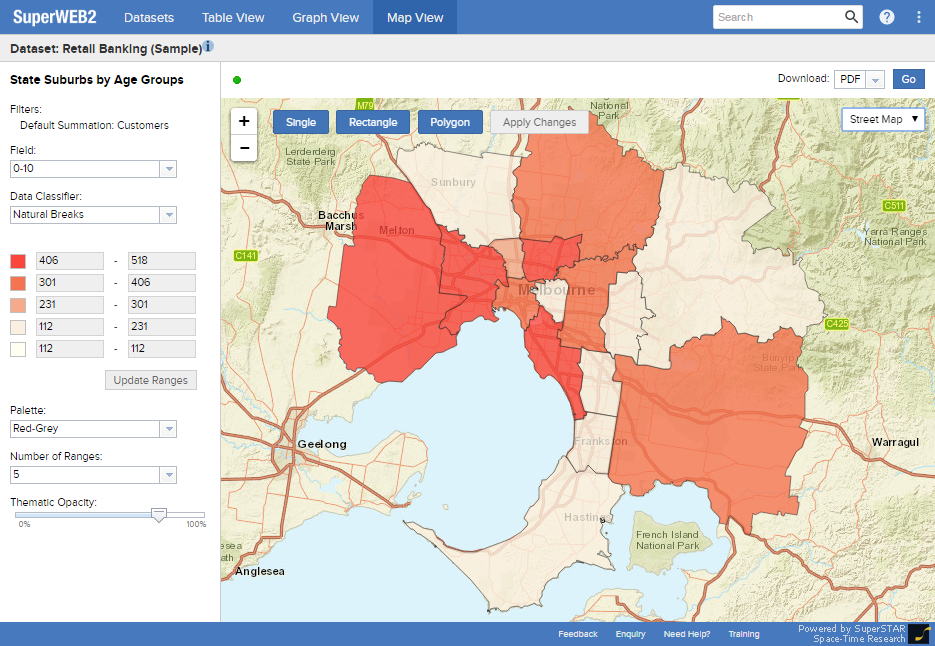
Customise the Map
Once you have generated your map, you can use the options to customise what is shown in the map and how it is displayed:
| Option | Description | Example | ||||||||
|---|---|---|---|---|---|---|---|---|---|---|
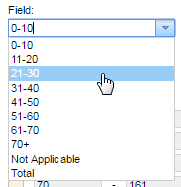
| Field | Select the field or summation option you want to visualise on the map. The options available will depend on the fields and summation options that were included in your original table. | 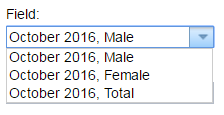 | ||||||||
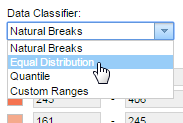
| Data Classifier | Select the data ranges that will be displayed on the map:
|
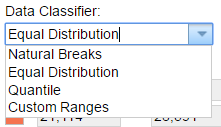 | ||||||||
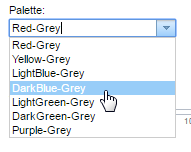
| Palette | Choose the colours used to highlight the different regions in the map. | 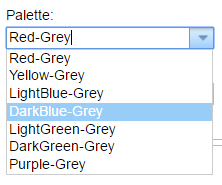 | ||||||||
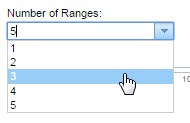
| Number of Ranges | Select the number of different coloured ranges you want to display on the map. |
 | ||||||||
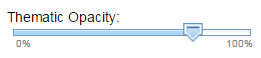
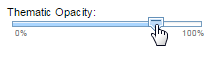
| Thematic Opacity |
Use the slider to control the opacity of the coloured areas on the map.
|
 | ||||||||
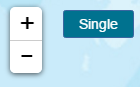
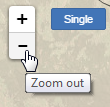
| Zoom |
Use the zoom buttons to zoom in and out of the map. |
 | ||||||||
| Pan | Click and drag anywhere on the map to pan around the map. | |||||||||
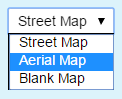
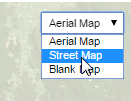
| Map Type | Select an option from the drop-down list in the top right corner to change between the different map types. By default, you can select from a streetmap, satellite view and a blank map. |
 | ||||||||
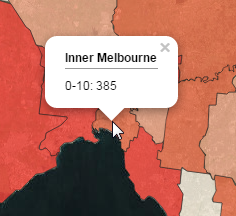
| Pop-Up Information |
Click any region in the map to see the name and value for this region. Please note that the name that is displayed in the pop-up is provided by the external mapping service, so it may not match the current user interface or dataset language. It will show the name in whatever language your administrator used when configuring this region in the external mapping service. |
 |
Edit What is Displayed in the Map
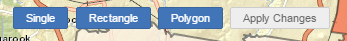
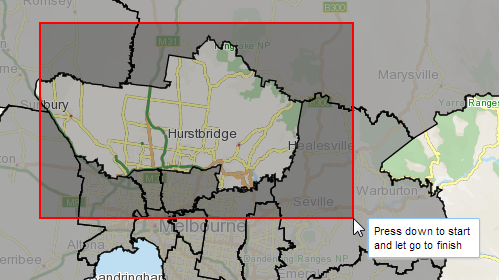
If you see these options at the top of the map, you can use them to change the areas that are visualised on your map from within Map View itself:
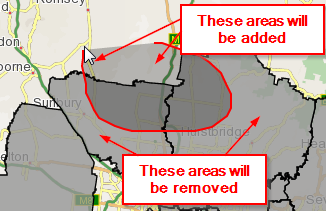
When you click one of the buttons, the map changes to "Edit Mode". In this mode, all the areas currently included in the map visualisation are highlighted in a single colour:
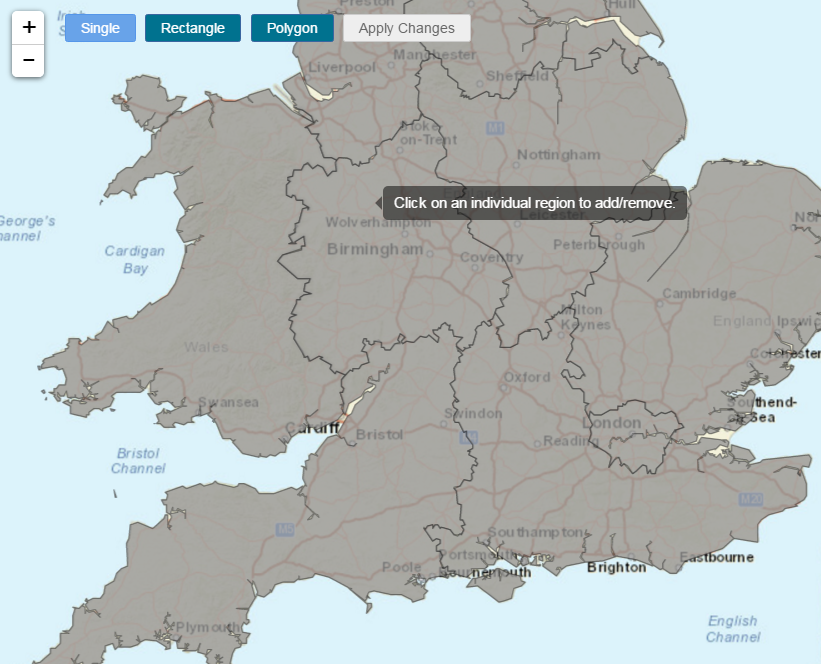
You can then select areas you want to remove from the map, as well as add new areas to the map, even if they were not included in the table (although you can only add areas to the map if there is data for those areas in the dataset). Adding areas to the map will also add them to the table (you can see this change if you switch back to Table View).
The three options work as follows:
| Option | Description |
|---|---|
| Single |
|
| Rectangle | The rectangle is similar to freehand, except that you click and drag to draw a rectangle over the areas you want to toggle, instead of a freehand shape. |
| Polygon |
Click to start drawing a shape, then click again as many times as you need to add a point and continue drawing the shape. To complete the shape, either click again on the first point, or double-click.
|
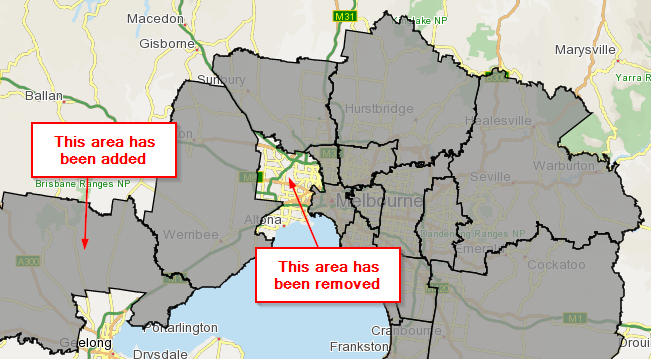
When you have finished selecting regions, click Apply Changes to apply your changes and return to the map visualisation.
You can also modify the areas that are visualised on the map by switching back to Table View and modifying the table, then returning to Map View.
Download the Map
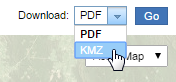
To download your map:
Select the download format from the drop-down list. Currently you can choose from either KMZ format (which you can use in tools such as Google Earth) or PDF.

- Click Go. The map will download at the current zoom level, showing the same section of the map that is currently visible on screen.
Note for IE9 Users: "The Browser you are using Cannot Display this Map"
If you are using Internet Explorer version 9, you may see an error message in Map View similar to the following, indicating that "the browser you are using cannot display this map (too many vertices)':
The easiest way to resolve this issue is to upgrade to a more recent browser, such as the latest version of Internet Explorer, Chrome, or Firefox.
