When you are working in Stat-Xplore, you will be building up tables that contain the information you are interested in.
Rows and Columns
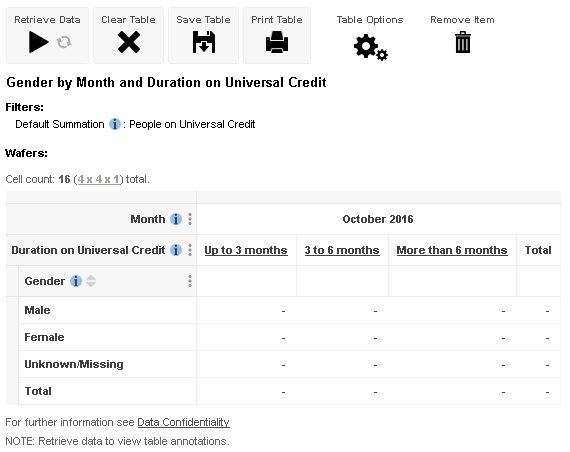
Basic tables only have fields in the rows and columns. For example, in this table the Duration on Universal Credit field is in the columns, and the Gender field is in the rows:
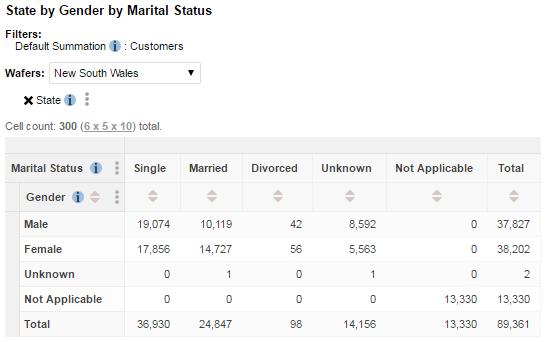
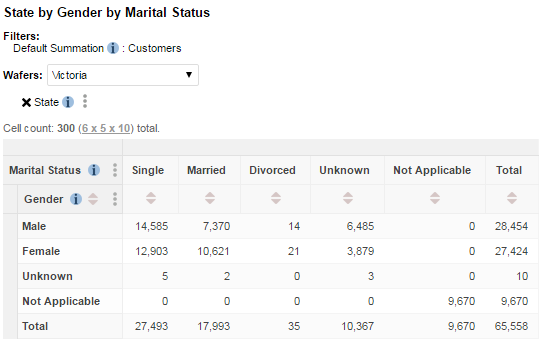
Wafers
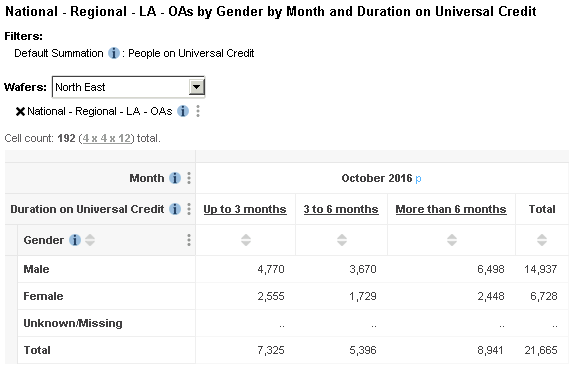
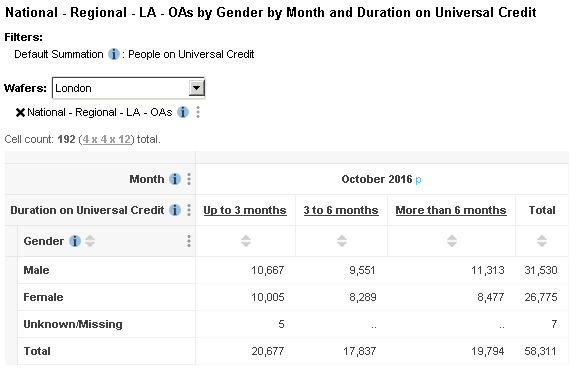
Adding a field to the wafer turns the two dimensional table into a three dimensional cube.
For example, by adding Region to the wafer we can see the numbers for specific regions. Select the region you are interested in from the drop-down list to update the table:
Adding Multiple Fields to an Axis
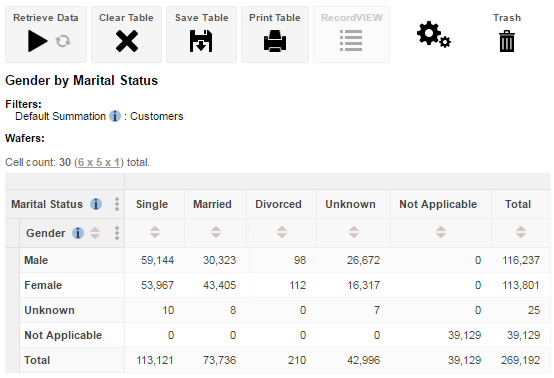
You can add multiple fields to the rows, columns, and wafers. The fields will always be nested.
Filters
In addition to rows, columns, and wafers, it is also possible to apply filters to a table. Only records that match the filters will be included in the results. Learn more...
